


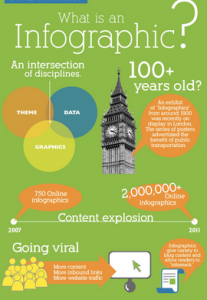
 Infographics have become a popular way to quickly share information. In such a fast-paced society, it’s important to get your information expressed quickly and easily. If it can be memorable, even better! People love to share pictures and infographics on their social media pages. Shares of your infographics can increase web traffic and awareness of your organization.
Infographics can be used to educate donors, start a conversation or as a call to action and can range from promoting a how-to process to compare and contrast or demographics. So, how can nonprofits best make use of infographics?
- Try a new spin on your Annual Report. A well thought out infographic can tell your story quickly for those who may not have the time to read a lengthy report.
- Show how easy it is to donate or volunteer with a “how-to” infographic. Showing the process in colorful, easy to read steps.
- Use an infographic to share numbers relating to your organizations mission. This can be financial goals or facts and figures relating to your mission. Make the figures and financials “pop” with color and a graphic that makes sense
- Demographics can be shared in an easy-to-read inforgraphic. With fewer words, information can be found quickly.
- Inforgraphics are great for displaying a timeline. Share the history of your organization or the timeline for a capital campaign or other project.
- Use an infographic to display tips, such as the top 5 ways a potential volunteer can help your organization or the top 5 needs of your organization for potential donors.
Infographics can be used in everything from direct mail, email and social media to videos, annual reports and promotional takeaways. Get on board with this potentially powerful tool and show what your organization is about.